

If you’ve ever sat through a college lecture on corporate governance and wondered how a company with thousands of employees, dozens of regulations, and hundreds of active risks keeps track of it all without losing its mind, the answer usually comes down to one tool: a compliance dashboard built for exactly this job.
It sounds like corporate jargon at first, but once you understand what it does, you start seeing why almost every serious organization — from banks to hospitals to universities — relies on one to stay out of trouble.
This blog breaks the concept down in plain language. No dense textbook definitions, no assumption that you already know what a “control objective” is. Just a clear, honest explanation of what this kind of dashboard actually does, why it exists, and why it’s becoming one of the most important tools in the world of governance, risk, and compliance.
What Exactly Is a GRC Dashboard?
A GRC dashboard is a centralized, visual interface that pulls together an organization’s governance, risk, and compliance data into one place.
Instead of digging through spreadsheets, emails, and separate departmental reports, a manager or compliance officer can open a single screen and instantly see where the company stands: which regulations are being followed, which risks are trending upward, which controls have failed a test, and which deadlines are coming up.
Think of it the way you’d think of a car’s dashboard. You don’t need to understand the entire engine to know your fuel is low or your engine light is on—the dashboard translates complicated internal systems into a few numbers and warning lights you can act on immediately.
The same logic applies here: it turns an organization’s compliance management, risk posture, and internal controls into something a person can actually act on. It converts thousands of data points into charts, scorecards, and alerts that a non-technical executive can actually use to make decisions.
Most modern platforms build this kind of dashboard around a handful of connected data streams: policy documents, audit findings, incident logs, regulatory updates, and risk registers.
When one of these feeds changes — say, a new data-privacy law takes effect, or an internal audit flags a gap — the dashboard updates automatically, so nobody is relying on someone remembering to send an email.
Why a GRC Dashboard Matters for Modern Organizations
Here’s the uncomfortable truth: most compliance failures aren’t caused by a lack of rules. They’re caused by a lack of visibility. A company can have every policy written correctly and still get fined millions of dollars because nobody noticed a control had quietly stopped working three months earlier. This is exactly the gap this kind of system is built to close.
A well-designed dashboard like this matters for a few concrete reasons:
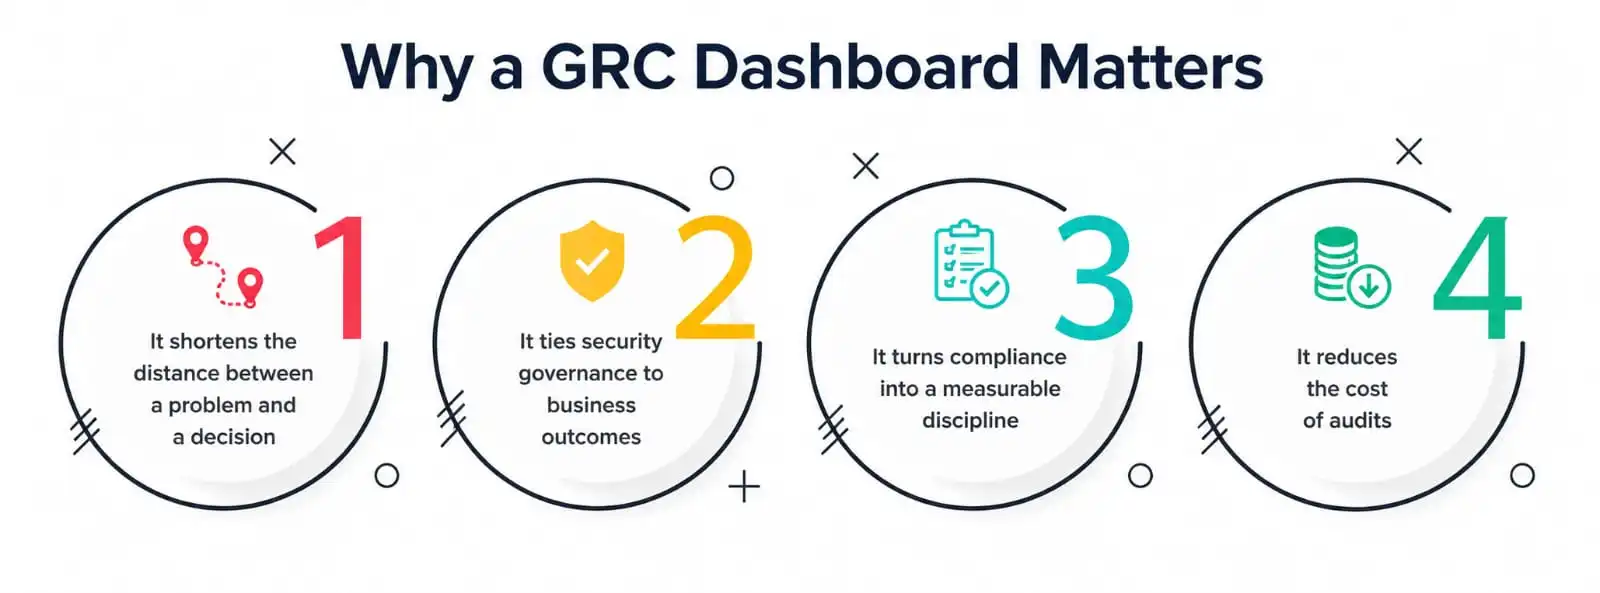
- It shortens the distance between a problem and a decision. Instead of waiting for a quarterly report, leadership sees issues as they emerge.
- It ties security governance to business outcomes. Cybersecurity, data privacy, and operational risk stop being siloed IT concerns and become visible boardroom metrics.
- It turns compliance into a measurable discipline. Rather than “we think we’re compliant,” teams can point to real performance metrics that prove it.
- It reduces the cost of audits. When evidence is already organized and time-stamped, an audit that used to take six weeks can often be finished in two.
For students studying business, information systems, or cybersecurity, this is worth internalizing early: organizations don’t just want people who understand rules—they want people who can read this kind of dashboard, interpret what it’s showing, and act on it before a small issue becomes a regulatory headline.
Core Components Every Compliance Dashboard Should Have
Every vendor designs their interface a little differently — analysts like Gartner track this market closely precisely because the tooling changes so fast — but almost all dashboards in this category are built from the same core building blocks. Here’s a simple breakdown:
|
Component |
What It Actually Shows |
Why It Matters |
|
Risk Heat Map |
Visual grid of risks by likelihood and impact |
Helps leaders prioritize which risks need attention first |
| Compliance Status Tracker | Real-time status against regulations (GDPR, HIPAA, SOX, ISO standards) | Shows exactly where gaps exist before regulators find them |
|
Audit Trail Log |
Chronological record of who did what, and when |
Speeds up audit reporting and proves accountability |
|
Control Testing Panel |
Pass/fail results of internal control checks |
Flags weak controls before they cause a breach or violation |
|
Policy Management Tracker |
Status of policy reviews, approvals, and renewals |
Keeps compliance management organized instead of scattered |
|
KPI/KRI Scorecards |
Key performance and key risk indicators in one view |
Converts raw data into performance metrics leadership can act on |
Once you see it laid out this way, the appeal becomes obvious. It doesn’t invent new information — it organizes information that already exists inside the organization but was previously scattered across departments that rarely talked to each other.
How a GRC Dashboard Supports Compliance Monitoring and Audit Reporting?
One of the most practical uses of this kind of system is continuous compliance monitoring. Traditionally, compliance checks happened once a quarter or once a year, which meant a violation could go unnoticed for months.
With a dashboard in place, compliance monitoring becomes an ongoing process instead of a periodic event—the system flags anomalies the moment they appear, whether that’s a missed training deadline, an expired certification, or a policy that hasn’t been reviewed on schedule.
This constant tracking feeds directly into audit reporting. When auditors — internal or external — come knocking, the difference between a stressful, disorganized audit and a smooth one usually comes down to how well the evidence was tracked. A dashboard that has been logging activity all year makes the reporting process almost mechanical: pull the relevant date range, export the trail, and hand it over.
Compare that to a company that has to manually reconstruct six months of decisions from email threads, and it’s easy to see why regulators and auditors increasingly favor organizations with structured compliance monitoring systems in place.
For students learning about internal audit or assurance, this is a good place to pay attention: audit reporting is no longer just about producing a document after the fact. It’s about maintaining an evidence trail so continuous that the report almost writes itself.
GRC Dashboard vs Traditional Spreadsheets: The Compliance Management Shift
A lot of smaller organizations still run their compliance management out of spreadsheets, shared drives, and email chains. It works — until it doesn’t. Spreadsheets don’t send alerts. They don’t cross-reference a new regulation against existing policies. They don’t show you, in real time, that a vendor’s certification expired last week.
Switching to this kind of platform represents a genuine shift in how compliance is practiced day to day, not just a cosmetic upgrade. Where a spreadsheet is a static record of the past, a dashboard is a living system that reflects the present.
This distinction matters more than it sounds: regulators increasingly expect organizations to demonstrate ongoing compliance management, not a one-time snapshot taken before an audit. A single missed update in a spreadsheet can sit unnoticed for a year; the same gap on a properly configured system triggers a flag within days.
Security Governance and Performance Metrics: The Numbers That Matter
Security governance used to be treated as a purely technical function — something the IT department handled quietly in the background. That’s changed. Boards now expect it to be reported with the same rigor as financial performance, and a centralized dashboard is usually the tool that makes that reporting possible.
On a mature dashboard, this shows up as tracked metrics: how many systems are patched, how many phishing simulations failed, and how long it took to close a known vulnerability. These aren’t abstract numbers — they’re performance metrics that boards, regulators, and insurers increasingly ask to see before trusting an organization with sensitive data.
A company that can produce clear numbers around its security governance posture is in a fundamentally stronger negotiating position than one that can only offer reassurances.
This is also where GRC platforms earn their value for growing businesses: as an organization scales, tracking security governance and performance metrics by hand becomes physically impossible. A dashboard is what makes it sustainable.
How to Choose the Right GRC Dashboard?
Not every dashboard in this category is built for the same audience, and picking the wrong one is a common — and expensive — mistake.
A few practical questions worth asking before choosing one:
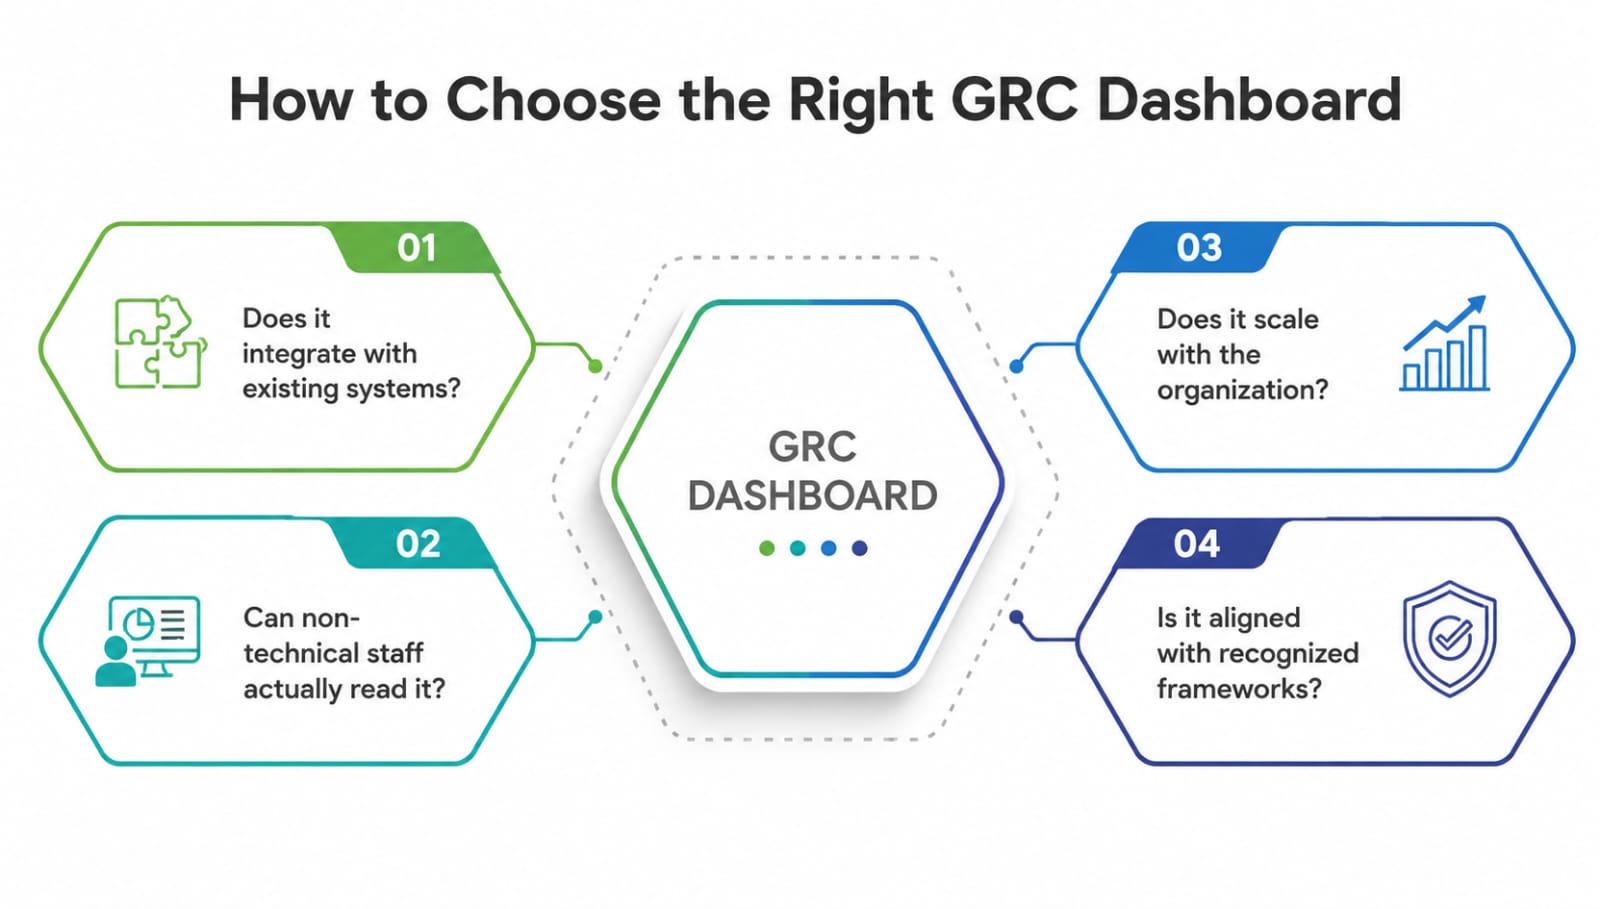
- Does it integrate with existing systems? A dashboard that can’t pull data from HR, IT, and finance tools will always be incomplete.
- Can non-technical staff actually read it? If only the compliance team understands the dashboard, it has failed its main purpose.
- Does it scale with the organization? A tool built for a 50-person startup may collapse under the data volume of a 5,000-person enterprise.
- Is it aligned with recognized frameworks? Dashboards built around established standards such as the NIST Risk Management Framework, ISO 31000, or the COSO Enterprise Risk Management Framework tend to be far easier to defend during a regulatory review.
Common Mistakes Organizations Make When Implementing One
Rolling out a new dashboard sounds simple in theory, but plenty of organizations get it wrong in practice.
A few patterns show up again and again:
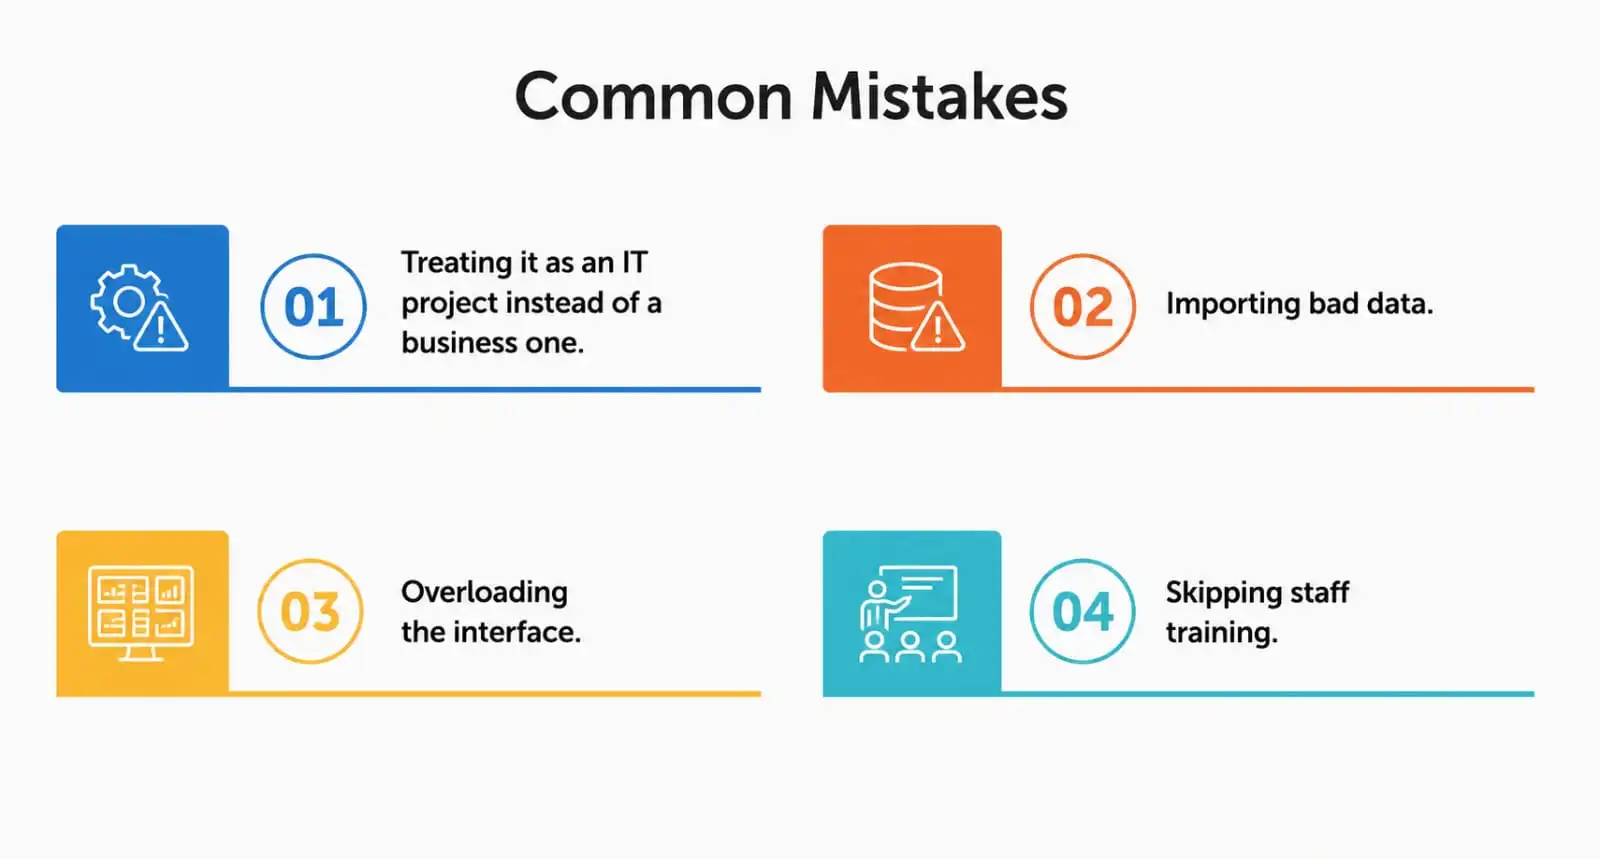
- Treating it as an IT project instead of a business one. When only the technical team is involved in setup, the tool ends up reflecting IT priorities instead of the risks the business actually cares about.
- Importing bad data. A dashboard is only as reliable as the information feeding it. If underlying risk registers or policy documents are outdated, the visualizations will look polished but mean nothing.
- Overloading the interface. Trying to show every possible metric on one screen usually backfires — executives stop checking a dashboard that takes ten minutes to interpret.
- Skipping staff training. Even the best-designed tool fails if the people responsible for updating it don’t understand why the data matters, not just how to enter it.
None of these mistakes are technical failures so much as planning failures. They’re avoidable with a bit of foresight, which is exactly why the selection questions in the previous section matter as much as the software itself.
A Practical Example for Students
Imagine a mid-sized healthcare company handling patient data under HIPAA. Before this kind of system was implemented, compliance monitoring depended on a single analyst manually checking access logs once a month. When unauthorized data access happened, it took nearly seven weeks to discover it—well past the legal notification window.
After adopting a dashboard, the same access anomaly would trigger an automatic alert within hours, feed directly into the audit reporting workflow, and generate a performance metric that leadership could review at the next governance meeting.
That’s not a hypothetical improvement — it’s the entire reason regulators and industry bodies such as ISACA push organizations toward structured, framework-based oversight rather than manual tracking.
Conclusion
A GRC dashboard isn’t a luxury reserved for Fortune 500 companies anymore—it’s becoming the baseline expectation for any organization that handles sensitive data, operates under regulation, or simply wants to know what’s actually happening inside its own walls.
For students heading into careers in compliance, audit, cybersecurity, or risk management, understanding how this technology works isn’t optional background knowledge. It’s the tool you’ll likely be reading, building, or defending in front of a board within the first few years of your career.
A Personal Note
I’ve sat through enough compliance meetings to know that most people don’t fear regulation itself—they fear not knowing where they stand until it’s too late. The first time I actually watched a well-built compliance dashboard flag a control failure in real time, before it became a headline-worthy incident, it changed how I thought about compliance entirely.
It stopped being paperwork and started being an early-warning system. If you’re a student reading this and compliance sounds boring on paper, I’d encourage you to look at it through that lens instead: it’s less about rules and more about building the kind of visibility that lets an organization catch its own mistakes before someone else does.