

If you have ever stared at a spreadsheet listing four thousand vulnerabilities and wondered where to even begin, you already understand the problem this framework is built to solve. Security teams don’t struggle because they lack data.
They struggle because raw data—logs, scan results, alerts, and audit findings—doesn’t tell anyone what to fix first. It takes that noise and turns it into a single, comparable number that a student, a CISO, or a board member can actually read and act on.
This guide breaks down how this kind of model is built, why it matters more than ever as cyber exposure grows, and how you can start thinking about risk the way working security analysts do. It’s written for students and early-career professionals who want the practical version, not the textbook version.
What Is a Risk Scoring Model?
It is a structured method for converting many different risk factors — likelihood of attack, potential impact, asset value, and existing defenses — into one numeric or categorical score. Instead of saying “this system is risky,” the model says “this system scores 78 out of 100,” which can be tracked, compared, and reported over time.
At its core, most versions of this kind of model follow a simple logic: Risk = Likelihood × Impact. Likelihood asks how probable an attack or failure is. Impact asks how damaging it would be if it happened. Some models add a third variable — the strength of existing security controls — since a well-defended asset lowers the effective risk even when the underlying threat is severe.
NIST’s Cyber Risk Scoring program is one of the clearest real-world examples. It was built to give NIST’s own IT systems a shared, quantitative basis for comparing risk across very different assets—something a purely qualitative “low, medium, high” label can’t do well. That’s the whole point of the approach: it replaces gut feeling with a repeatable method that produces the same answer no matter who runs the numbers.
Why Does a Risk Scoring Model Matter Right Now?
Cyber exposure has grown faster than most security teams’ headcount. Cloud services, remote work, shadow IT, and third-party integrations have all multiplied the number of places an attacker can get in.
According to Trend Micro’s overview of cyber risk scoring, scoring is meant to be continuous — scores get refreshed regularly so teams can see which parts of their cyber exposure are getting worse and which have actually improved.
Without a scoring system, every new finding competes for attention equally, and equal attention to unequal risks is how real incidents slip through. A structured security assessment paired with a scoring model gives teams a defensible answer to the question every executive eventually asks: “Why are we fixing this one first?”
There’s also a communication problem this kind of scoring solves. Technical teams think in CVEs, ports, and misconfigurations. Leadership thinks in dollars, reputation, and regulatory exposure. A well-designed scoring system acts as a translator between the two groups, turning a technical finding into a business-relevant number everyone in the room can argue about using the same terms.
The Core Components of a Risk Scoring Model
Every credible version of this framework, regardless of industry, tends to pull from the same handful of ingredients:
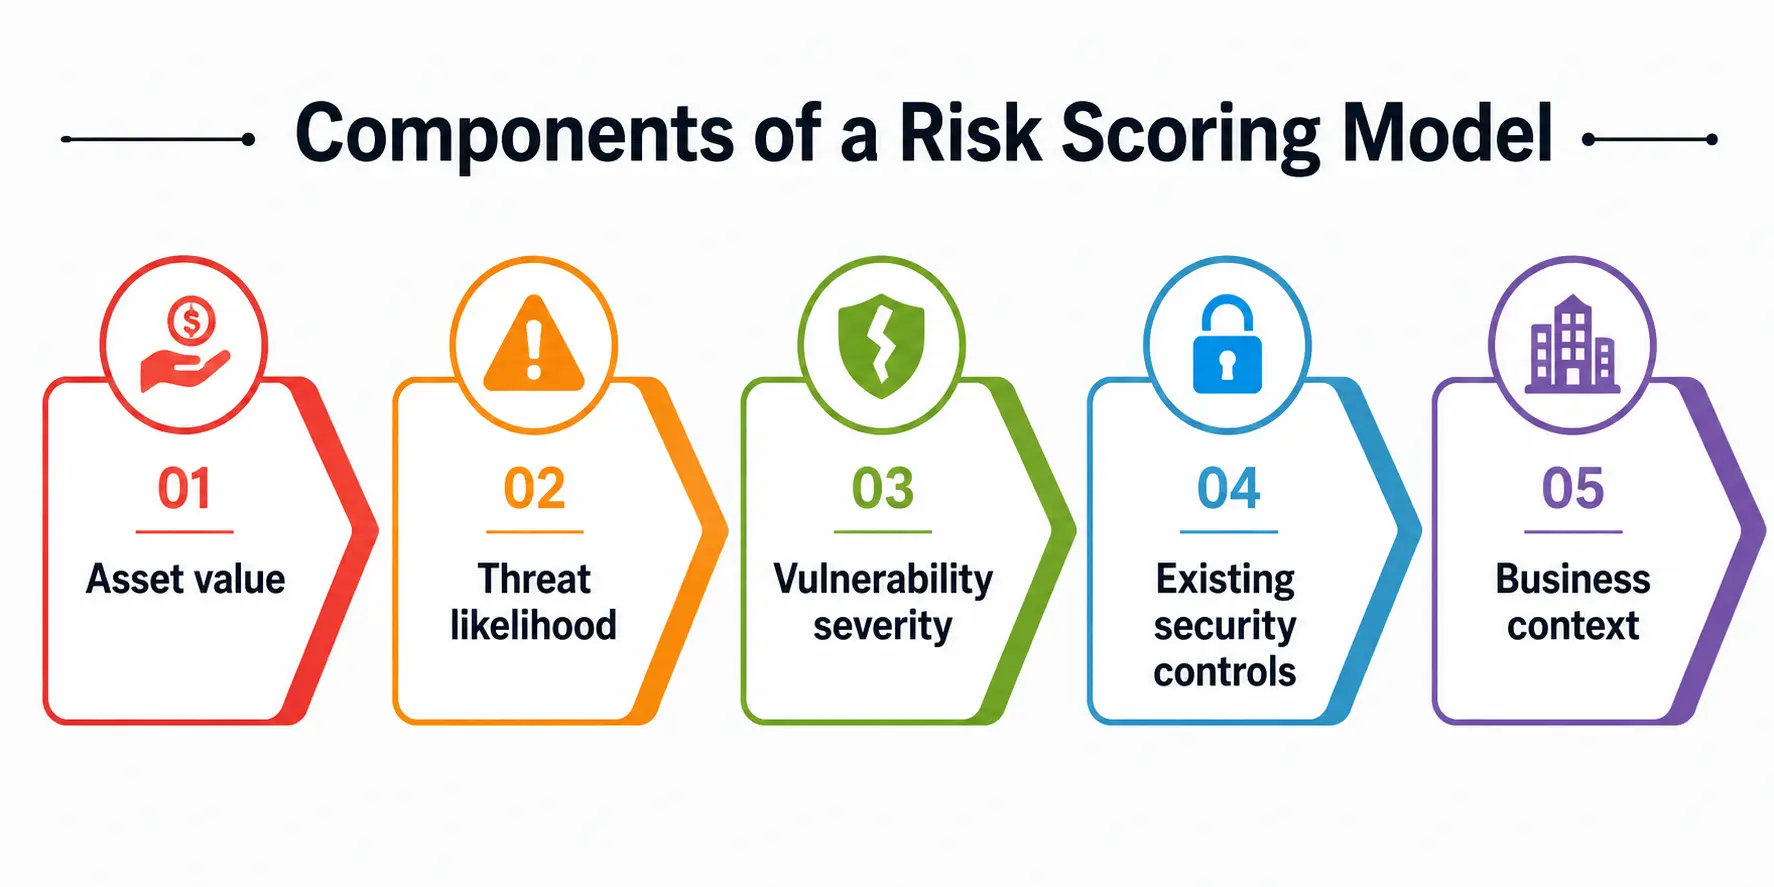
- Asset value – What does this system, dataset, or process actually cost the organization if it’s lost, exposed, or taken offline?
- Threat likelihood – How probable is exploitation, based on exposure, attacker interest, and known exploit activity?
- Vulnerability severity – How exploitable is the flaw itself, often drawn from standards like CVSS?
- Existing security controls—Firewalls, access restrictions, monitoring, and patching cadence all reduce effective risk even when the raw vulnerability score is high.
- Business context – Regulatory obligations, customer data sensitivity, and operational dependencies.
Security controls deserve special attention here because they’re the variable most teams underaccount for. A critical vulnerability sitting behind strong segmentation, strict identity controls, and active monitoring is genuinely less dangerous than the same vulnerability on an exposed, unmonitored server—even though the raw severity number is identical.
Any model that ignores the strength of those defenses will systematically overstate risk on well-defended systems and understate it on neglected ones.
Not Every Scoring Approach Is Built the Same Way
There isn’t one universal formula. Different frameworks trade off simplicity against accuracy, and picking the right one depends on what the organization actually needs the score for—quick triage, executive reporting, or financial planning.
|
Approach |
What It Measures | Best For |
Limitation |
|
CVSS (Common Vulnerability Scoring System) |
Technical severity of a single vulnerability | Fast, standardized vulnerability triage |
Doesn’t factor in business context or real-world exploitation |
|
NIST Risk Scoring / CSF-based models |
Control effectiveness mapped to CIA (confidentiality, integrity, availability) | Federal and compliance-driven environments |
Can be labor-intensive to maintain at scale |
|
FAIR (Factor Analysis of Information Risk) |
Financial loss probability and magnitude | Executive and board-level risk communication |
Requires more data and statistical comfort to apply well |
|
EPSS (Exploit Prediction Scoring System) |
Probability a vulnerability will be exploited in the wild | Prioritizing patch order among many CVEs |
Works best alongside, not instead of, severity scoring |
As Safe Security’s research on modern risk-based prioritization points out, a critical-looking CVSS score on an isolated system with no internet exposure can matter far less than a moderate score on an internet-facing system that’s already being actively targeted.
That gap between theoretical severity and real-world danger is exactly why a single-metric approach usually isn’t enough and why mature programs blend two or three of the models above.
The FAIR model takes a different angle entirely. Instead of a 1-to-10 severity number, it estimates how often a loss event is likely to happen and how much it would cost if it did, then multiplies the two together to get an expected annual loss figure. That output is far easier for a finance team to plug into a budget conversation than a technical severity rating ever could be.
From Score to Action: Risk Prioritization
A number by itself doesn’t protect anything — what matters is what a team does with it. This is where risk prioritization comes in: taking a ranked list of scored risks and deciding what gets fixed this week, this quarter, or not at all given limited resources.
Good risk prioritization isn’t just “fix the highest number first.” It accounts for remediation costs, business disruption, and dependencies between systems. A moderate-risk finding that takes ten minutes to patch might get fixed before a higher-scored issue that requires a multi-week migration.
This is also where Rapid7’s argument against relying on CVSS alone becomes useful—the piece makes the case that pairing severity scores with exploit-prediction data and knowledge of existing security controls produces far better prioritization decisions than severity scores alone would.
This kind of prioritization typically follows three questions in order:
- Is this actively being exploited, or realistically exploitable, right now?
- What does it actually protect, and how sensitive is that asset?
- How much effort and disruption will fixing it cause?
Answering these consistently — instead of case by case — is what separates an organized security program from one that’s constantly firefighting.
Building a Risk Scoring Model Step by Step
For students building their first version, whether for a class project or a portfolio piece, a workable model doesn’t need to be complicated to be useful.
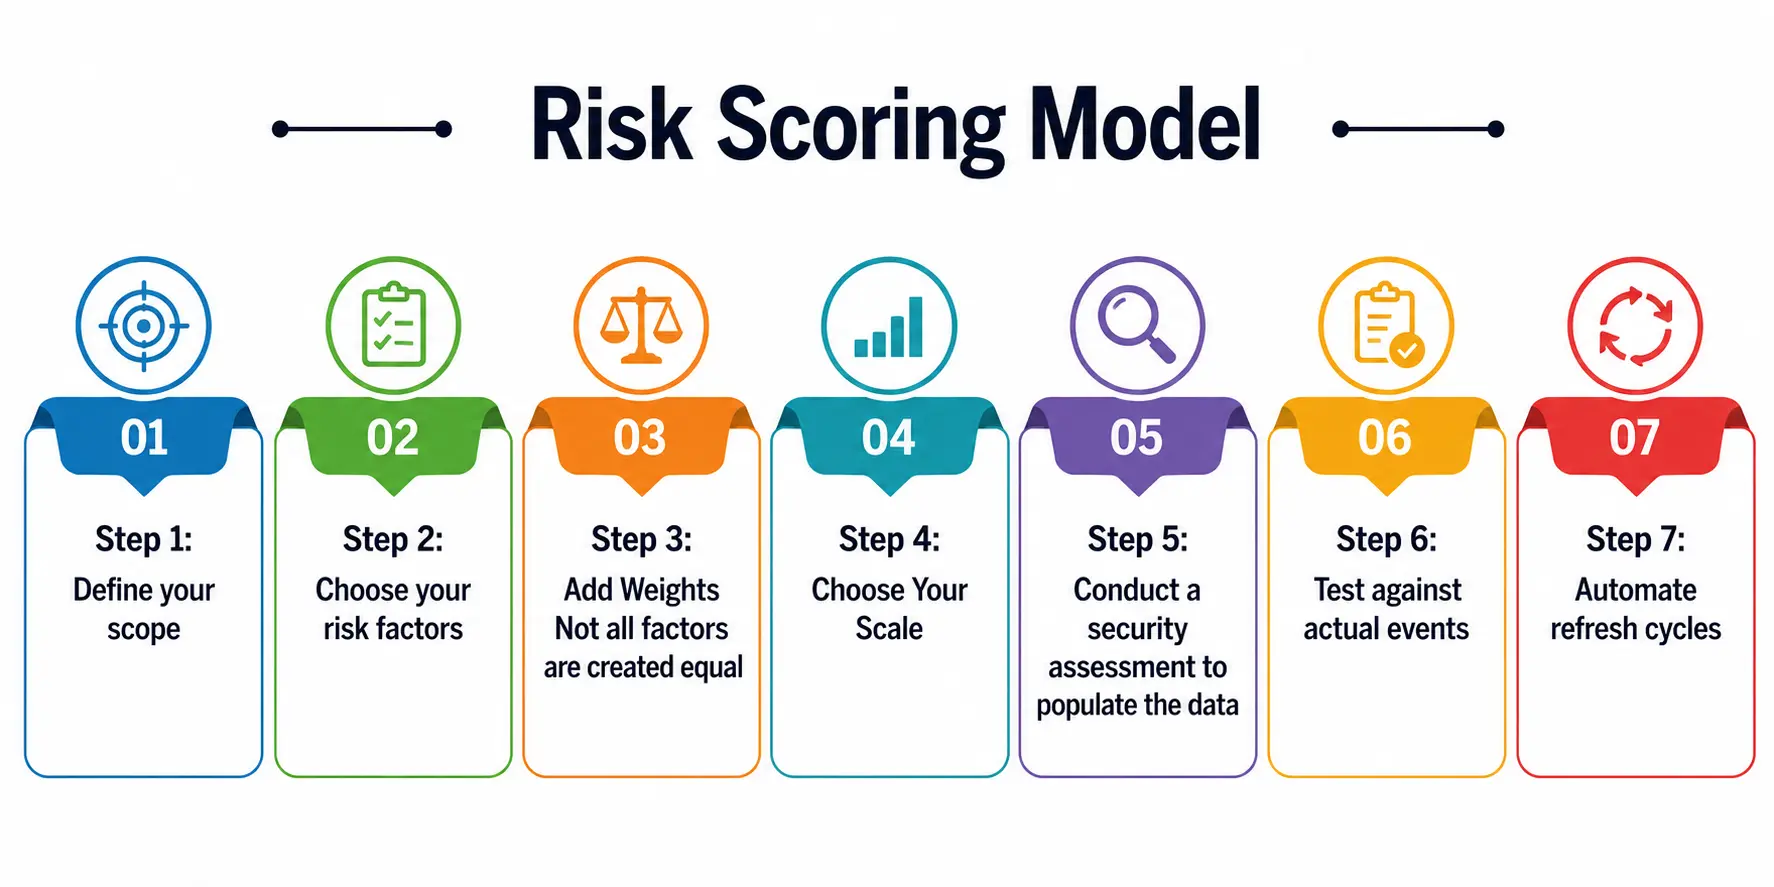
Step 1: Define your scope
Decide what you’re scoring — applications, servers, vendors, or business processes — before touching a formula.
Step 2: Choose your risk factors
Include likelihood, impact, and strength of current defenses at a minimum. Add regulatory sensitivity if assets involved contain personal or financial data.
Step 3: Add Weights Not all factors are created equal
A marketing microsite might not weigh impact as heavily as a finance system with card data.
Step 4: Choose Your Scale
Usually a 1–10 or 1–100 scale. Standardize across all assets so scores remain comparable.
Step 5: Conduct a security assessment to populate the data
The quality of any scoring system is only as good as the inputs that feed into it, and those inputs come from a structured security assessment of each asset—checking configurations, patch levels, control of access, and exposure to the internet.
Step 6. Test against actual events
If your highest-scoring assets do not correlate to actual incidents over time, then you need to adjust the weightings.
Step 7: Automate refresh cycles
Manual scoring becomes stale fast. Even a simple scheduled security assessment keeps the model current as new vulnerabilities and controls change month to month.
Where Does Risk Intelligence Fit In?
A scoring system that runs on stale or purely internal data will eventually miss the threats that matter most. This is where risk intelligence comes in—external context about which vulnerabilities are being actively exploited, which threat actors are targeting your industry, and how your organization’s cyber exposure is shifting week to week.
Feeding risk intelligence into a scoring model is what separates a static compliance checklist from a system that actually reflects present-day danger. A vulnerability that looked low-priority six months ago can become urgent overnight once proof-of-concept exploit code appears publicly.
Programs that treat it as a one-time input rather than a continuous feed tend to fall behind attackers who move faster than annual review cycles allow. Practically, this means pulling in threat feeds, exploit databases, and industry-specific advisories, then re-scoring affected assets automatically rather than waiting for the next scheduled review.
Mature security teams treat risk intelligence the way meteorologists treat weather data — a constant stream that updates the forecast, not a report you read once and file away.
A Quick Worked Example
Suppose you’ve run a routine scan of a mid-sized company’s environment and found three things: an unpatched content management system accessible from the internet, a moderate misconfiguration on an internal HR database, and a low-severity flaw on a retired test server nobody uses anymore.
The CMS could score 8 for likelihood (it’s public-facing, and the flaw has known exploit code) and 7 for impact (customer-facing content, some personal data in comment forms), giving a raw score of 56 before any adjustment, on a simple 1-10 scale for likelihood and impact.
The HR database misconfiguration has a likelihood of 4 (internal only, requires authenticated access) and an impact of 9 (sensitive employee records). This yields a score of 36. The test server, neglected, scores low on both axes – say 2 and 2 – for a raw score of only 4.
Multiply likelihood by impact and the ranking becomes obvious: fix the CMS first, address the HR database next, and leave the test server for a housekeeping sprint or decommission it outright. No spreadsheet macro or expensive platform was needed to reach that conclusion—just a consistent scale applied honestly across three very different assets.
Scale that same logic across a few hundred assets, add weighting for asset value and existing defenses, and you have the backbone of a working scoring program.
This exercise matters for one reason: numbers only help when the people relying on them trust the process behind them. A transparent, repeatable calculation earns that trust far faster than a black-box tool ever will, especially with a technical audience that will ask hard questions about how a number was reached.
Common Mistakes When Using a Risk Scoring Model
Even well-intentioned programs get this wrong in predictable ways:
- Treating the score as the whole story. A number is a starting point for a conversation, not a replacement for judgment.
- Ignoring existing security controls. Scoring raw vulnerability severity without accounting for compensating controls inflates risk and burns credibility with technical teams who know better.
- Letting scores go stale. Cyber exposure changes weekly. A model refreshed once a year is already out of date by the time anyone reads the report.
- Using one framework for every audience. A CVSS number means little to a board member; an annualized loss estimate means little to a patching engineer. Translate the same underlying output into the language each audience actually uses.
- Skipping validation. If nobody checks whether high scores actually predicted real incidents, the model is just guesswork wearing a number.
Bringing It All Together
A risk scoring model isn’t about producing an impressive-looking dashboard. It’s about giving people who have limited time and limited budget a defensible way to decide what to fix first.
Whether you’re leaning on CVSS for fast technical triage, FAIR for financial framing, or a blended approach that folds in live risk intelligence, the underlying goal stays the same: turn scattered, overwhelming risk data into something a human being can act on with confidence.
For students entering this field, understanding how this kind of scoring actually works—not just the formula, but the judgment calls behind the weights and thresholds—is one of the most transferable skills you can build.
Every security team, in every industry, eventually needs someone who can look at a pile of findings and say, with evidence, what matters most.
A Personal Note
I’ve sat through more than one meeting where a spreadsheet full of “critical” findings caused total paralysis—nobody could agree on where to start, and everything felt urgent, which meant nothing actually was. What changed things wasn’t a fancier tool; it was simply agreeing, as a team, on the risk factors that mattered and scoring consistently against them.
If you’re a student reading this, my honest advice is to build a small scoring model yourself, even a rough one in a spreadsheet, before you ever touch a commercial platform. You’ll understand the trade-offs in a way no lecture slide can teach you.