







Every data analyst job posting in the UK seems to want the same thing right now. Permanent vacancies citing Power BI as a required skill climbed to 2,307 in the six months to the end of October 2026, up from 1,887 a year earlier—a jump of roughly 22%—the figure reflects UK market demand specifically, not global hiring.
That single number explains why so many students and career-switchers are suddenly searching for a proper Power BI data analysis tool tutorial instead of another generic “what is business intelligence” article.
This guide is that tutorial. It walks through Power BI from a blank screen to a finished, shareable report, in the order a genuine beginner needs it. By the end, you’ll know how to clean data with Power Query, write your first DAX measures, apply strong data visuals, handle dashboard creation properly, and ship polished reports other people can actually use.
What Is the Power BI Data Analysis Tool?
Microsoft Power BI is a business analytics tool that connects to dozens of data sources, reshapes that data, and turns it into visuals and reports people can explore on their own. Calling it that rather than just a reporting app is fair—the whole product exists to take messy spreadsheets, databases, and cloud sources and turn them into something a manager can read in thirty seconds.
Under the hood, three things make this possible: a data-preparation layer (Power Query), a modeling and calculation layer (DAX), and a presentation layer where visual design and dashboard layout actually happen. Learning this platform well means learning all three layers, not just the drag-and-drop charts.
Why Do Businesses Need the Power BI Data Analysis Tool?
Power BI isn’t winning by accident. Industry tracking from 6sense, cited in an analytics market roundup from WebProNews, puts Microsoft’s business intelligence market share at 23.06%, ahead of every named competitor. Here’s why that lead keeps growing, in point form so the reasoning is easy to scan:
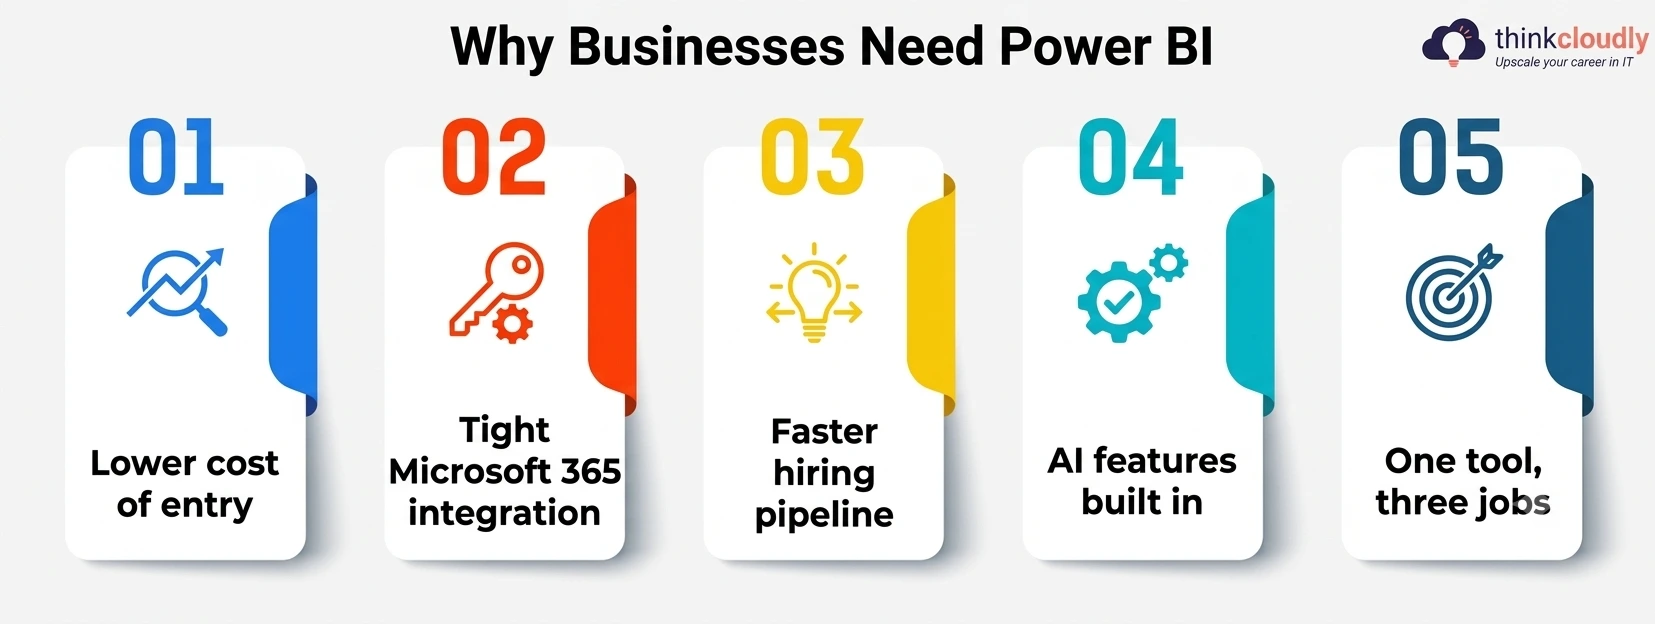
- Lower cost of entry. Power BI Pro runs roughly 10–20 per user monthly, well under many enterprise BI license tiers.
- Tight Microsoft 365 integration. Teams, already living in Excel, Teams, and SharePoint, can plug it in without learning a separate ecosystem.
- Faster hiring pipeline. Recruiters list Power BI ahead of other tools in job descriptions, so training new hires takes less time.
- AI features built in. Copilot-driven summaries and natural-language Q&A are now standard, closing the gap between “I have a dataset” and “I have an answer.”
- One tool, three jobs. A single Power BI license now covers data cleaning, modeling, and visual reporting—work that used to need three separate products.
Setting Up Power BI for the First Time
Download Power BI Desktop for free from Microsoft’s own site and sign in with a work, school, or personal Microsoft account. The interface opens into three main views along the left edge—Report, Data, and Model—and a ribbon across the top that controls almost everything below.
If this is genuinely your first time opening Power BI Desktop, resist the urge to click “Get Data” immediately. Spend five minutes clicking through the ribbon tabs first; knowing where Home, Insert, Modeling, and View sites will save real time once you’re mid-project.
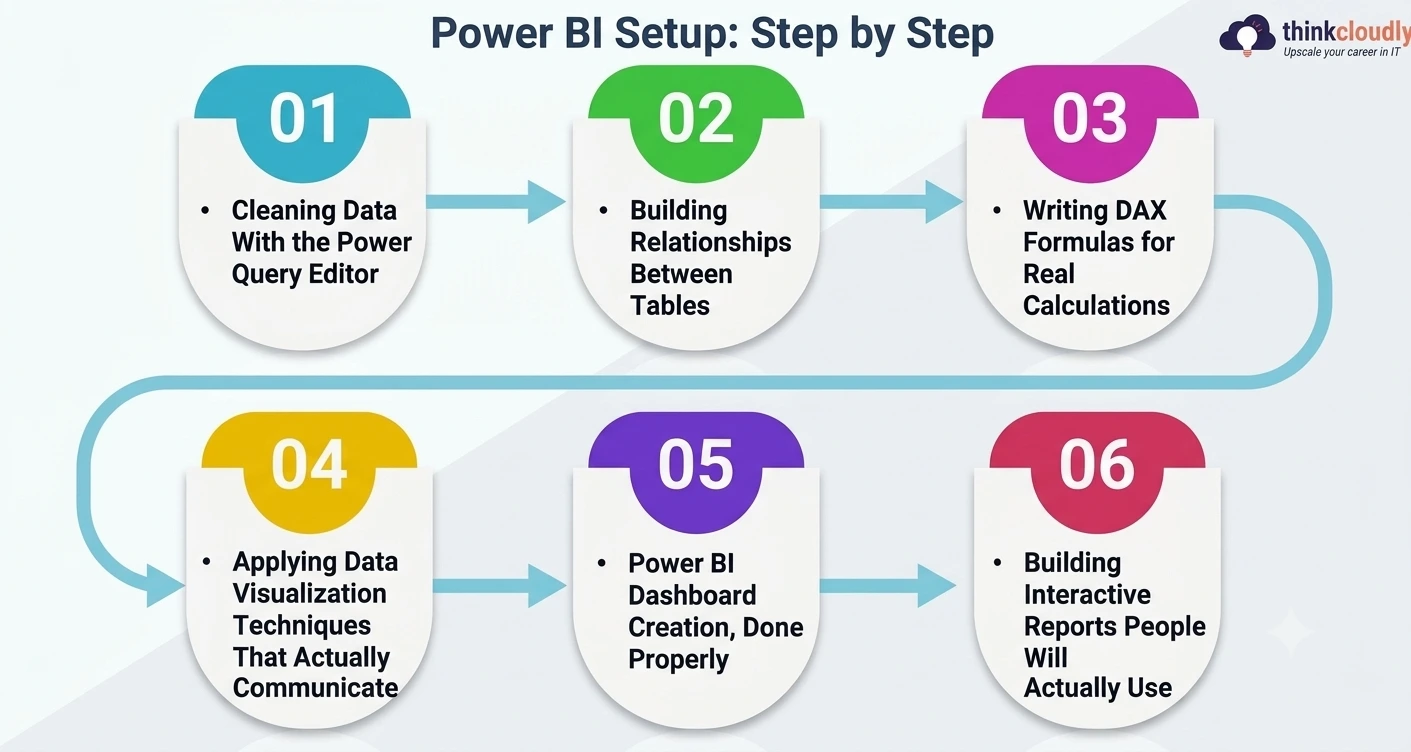
Step 1: Cleaning Data With the Power Query Editor
Every Power BI project starts the same way—importing data that is never as clean as you’d like. This is where the Power Query Editor earns its place as the most underrated part of the whole platform.
Click Get Data, choose a source (Excel, a CSV file, an SQL database, or a web page all work), then click Transform Data instead of Load. That opens the Power Query Editor—a separate window built entirely around reshaping data before it ever reaches your report. A few transformations cover most beginner needs:
- Remove unnecessary columns you won’t use in any visual to keep the model lean.
- Fix data types—dates or numbers stored as text will break calculations later.
- Split or merge columns, such as separating a full name into first and last fields.
- Remove duplicates and blank rows, which quietly distort totals and averages.
- Rename columns and queries, since “Column1” means nothing six months from now.
Every click gets logged as a step on the right-hand panel in order—effectively a repeatable recipe. Reopen the same report next month with refreshed data, and every transformation reapplies automatically.
Step 2: Building Relationships Between Tables
Switch to the model view once your data is clean. If you imported more than one table—say, Orders and Customers—Power BI will often guess at a relationship automatically, but check it manually. Drag a field from one table to the matching field in another to create the link, and set the cardinality (one-to-many is most common) correctly.
Getting this right matters more than beginners expect, because a bad relationship produces visuals with numbers that are confidently wrong rather than obviously broken—the kind of mistake nobody notices until someone asks why a total doesn’t match the source spreadsheet.
Step 3: Writing DAX Formulas for Real Calculations
DAX, short for Data Analysis Expressions, is the formula language behind every calculated column, measure, and KPI in Power BI. If Excel formulas feel familiar, DAX formulas will feel like a close cousin—similar syntax, but built to operate across entire tables and relationships rather than single cells. A few DAX formulas worth learning first:
- SUM() and AVERAGE() for basic aggregations, usually written as measures for better performance.
- CALCULATE(), which filters a calculation by a condition—total sales only for one region, say.
- SUMX(), an iterator that multiplies values row-by-row before summing—quantity times price, for example.
- Time-intelligence functions such as SAMEPERIODLASTYEAR() or DATEADD(), which make year-over-year comparisons possible without rebuilding the dataset.
Write DAX measures whenever possible rather than calculated columns—measures calculate on demand and keep file size and refresh time down as a dataset grows.
Step 4: Applying Data Visualization Techniques That Actually Communicate
This is the step most tutorials rush, yet it decides whether a report gets used or ignored. Good data visualization techniques aren’t about adding more charts—they’re about choosing the right chart for the question being asked. A short, practical set of data visualization techniques to default to:
- Bar and column charts for comparing categories against each other.
- Line charts for anything changing over time, especially trends across months or quarters.
- Cards and KPIs for the one or two numbers an executive actually needs at a glance.
- Matrix visuals instead of plain tables when the audience needs to drill into rows and columns.
- Slicers to let the viewer filter the page themselves, instead of building ten nearly identical pages.
The Power BI update, documented in the official Power BI Feature Summary, rolled out the Fluent 2 theme as the default for new reports and added a Theme pane for setting colors and text styles project-wide—a small change that makes consistent visual styling far easier to maintain across a multi-page report.
Step 5: Power BI Dashboard Creation, Done Properly
A report and a dashboard aren’t the same thing here, and mixing the two up trips up almost every beginner. A report is a multi-page file built in Power BI Desktop. A dashboard is a single-page, pinned summary built from visuals published to the Power BI service online—Power BI dashboard creation happens there, not on the desktop. To get from a finished report to a working dashboard:
- Publish the report from Desktop to the Power BI service (File > Publish).
- Open the published report online and pin individual visuals you want on the summary page.
- Arrange the pinned tiles on the dashboard canvas, resizing the most important KPIs to stand out.
- Set up data alerts on key tiles, so stakeholders get notified when a number crosses a threshold.
- Share the dashboard with a security group rather than individual emails, so access stays manageable.
Good dashboard creation leans on restraint—six well-chosen tiles that answer real questions beat eighteen tiles nobody reads past the first week.
Step 6: Building Interactive Reports People Will Actually Use
Interactive reports are what separate a static printout from something a stakeholder can genuinely explore. The core mechanism is cross-filtering: click a bar in one chart, and every other visual on the page filters to match, without a single line of code. A few habits make interactive reports noticeably better:
- Use bookmarks to save specific filter states as buttons, so a viewer can jump between pre-set views instantly.
- Add drill-through pages so a summary visual can send a viewer straight to the detail behind one data point.
- Use tooltips to show extra context on hover without cluttering the main page.
- Keep slicers visible on every page, so the layout stays consistent as the viewer navigates between pages.
The same August 2026 update also improved the Slicer visual with a dedicated date picker supporting relative-date and single-date selection, which makes building genuinely useful reports around rolling date ranges considerably less fiddly.
Power BI Data Analysis Tool: Core Workflow at a Glance
|
Stage |
What Happens |
Main Tool Used |
|
Connect |
Pull data from Excel, SQL, cloud apps, or the web. |
Get Data |
|
Clean |
Fix types, remove duplicates, reshape columns |
Power Query |
|
Model |
Build relationships between tables. |
Model view |
|
Calculate |
Write measures and calculated columns. |
DAX |
|
Visualize |
Choose charts that answer the right question. |
Report canvas |
|
Publish |
Push the finished file online for others |
Power BI service |
|
Summarize |
Pin key visuals to one tracked view |
Dashboard tiles |
Common Mistakes Beginners Make With the Power BI Data Analysis Tool
- Skipping the Power Query Editor and loading raw data directly. Fixing data types after the fact is far more painful than cleaning before you load.
- Writing calculated columns instead of measures. This bloats file size and slows down every refresh as the dataset grows.
- Overloading a single page. A report crammed with fifteen visuals is harder to read than three organized pages.
- Ignoring relationships until something breaks. A silently wrong total is worse than an error message, since nobody notices it right away.
- Confusing reports with dashboards. Expecting dashboard-creation features inside Desktop, where they don’t exist, wastes time hunting for a button that lives online instead.
Power BI Data Analysis Tool: Essential Skills Checklist
If you’re building a learning plan rather than reading this once and moving on, here’s what to actually practice:
- Data import and the Power Query Editor — practice on at least three source types (Excel, CSV, and one database connection).
- Table relationships and star-schema basics — build one dataset with three or more related tables from scratch.
- DAX formulas — write at least ten measures covering aggregation, filtering, and time intelligence.
- Data visualization techniques — rebuild the same dataset twice with two different chart choices, and notice which communicates faster.
- Power BI dashboard creation — publish one report and pin it to a dashboard, end to end.
- Interactive reports — add one bookmark, one drill-through page, and one slicer to a project before moving to the next.
What to Learn Next?
Finishing this walkthrough of the Power BI data analysis tool is a solid milestone. Row-level security, Power BI Copilot for natural-language queries, and deployment pipelines for managing reports across environments are the natural next stops once the fundamentals above feel comfortable — they all assume you already know how to clean data, model relationships, and build a page that communicates something.
A Personal Note
The first dataset I ever loaded into Power BI was a mess of inconsistent date formats and duplicate customer records, and I spent an embarrassing amount of time trying to fix it with visuals instead of going back to Power Query, where the real problem was sitting the whole time.
That mistake taught me more about this tool than any tutorial did: the flashy part of Power BI is the charts, but the unglamorous cleaning step underneath decides whether those charts tell the truth. If you take one thing from this guide, be patient with the boring parts — they’re the ones that matter once a real audience is looking at your report.