


Ask any security analyst what keeps them up at night, and you’ll hear some version of the same answer: they know something bad could happen, but they can’t tell you how bad, how likely, or what it would cost — at least not in a language the CFO understands.
That gap between “we have vulnerabilities” and “here is what those vulnerabilities could cost us next year” is exactly what Cyber Risk Quantification was built to close. Instead of red-amber-green heat maps and gut-feeling severity labels, this approach puts a number — usually a dollar figure or a probability range — on cyber risk, so leadership can compare a ransomware scenario to a compliance fine the same way they compare any other business decision.
If you’re a student heading into security, GRC, or risk analytics, this is one of the more in-demand skills you can pick up right now, because boards have largely stopped accepting “high, medium, low” as a complete answer.
What Does Cyber Risk Quantification Actually Mean?
At its core, Cyber Risk Quantification is the discipline of translating technical findings — an unpatched server, an exposed storage bucket, a weak authentication policy — into financial and probabilistic terms that a non-technical executive can act on.
A standard threat assessment tells you a vulnerability exists and rates it critical, high, or low. Quantification goes further: it estimates the likely annual loss if that vulnerability gets exploited, the probability of exploitation within a given year, and how that number shifts once you patch it.
For example, imagine two separate findings: an exposed admin login on a marketing microsite, and that same exposed login on a payment gateway. A qualitative scorer might label both “critical” and move on.
A quantitative model instead asks what data sits behind each one, how likely an attacker is to find and exploit it this year, and what the resulting loss would realistically look like — producing two very different numbers from what appeared, at first glance, to be the same finding.
Rather than reporting security metrics as raw counts — the number of open vulnerabilities, the number of failed login attempts, the number of unpatched endpoints — this approach converts those counts into an expected monetary loss range. That single shift, from counting problems to costing them, is why this discipline has moved from a purely technical exercise to a boardroom conversation.
Why Old-Style Threat Assessment Falls Short?
Most organizations still run a threat assessment process built around qualitative scales: a 1-to-5 severity score, or a red/amber/green label assigned largely by an analyst’s judgment. That works fine when you’re triaging a patch queue. It falls apart the moment you need to justify a multi-million-dollar security budget to a CFO who thinks in numbers, not colors.
Two vulnerabilities both labeled “critical” can carry wildly different financial consequences depending on which asset they sit on and what data flows through it, yet a purely qualitative scoring process often scores them identically.
That distinction matters more than it used to: IBM’s Data Breach Report found the global average cost of a breach was $4.44 million, while breaches in the United States averaged well over $10 million once regulatory fines and detection delays were factored in.
A red-amber-green chart cannot produce numbers like that, because it was never built to. Quantification forces every estimate onto a comparable financial scale, which is exactly the limitation it was designed to fix.
The Three Building Blocks: Attack Surface, Exposure, and Metrics
Every credible quantification program rests on three inputs.
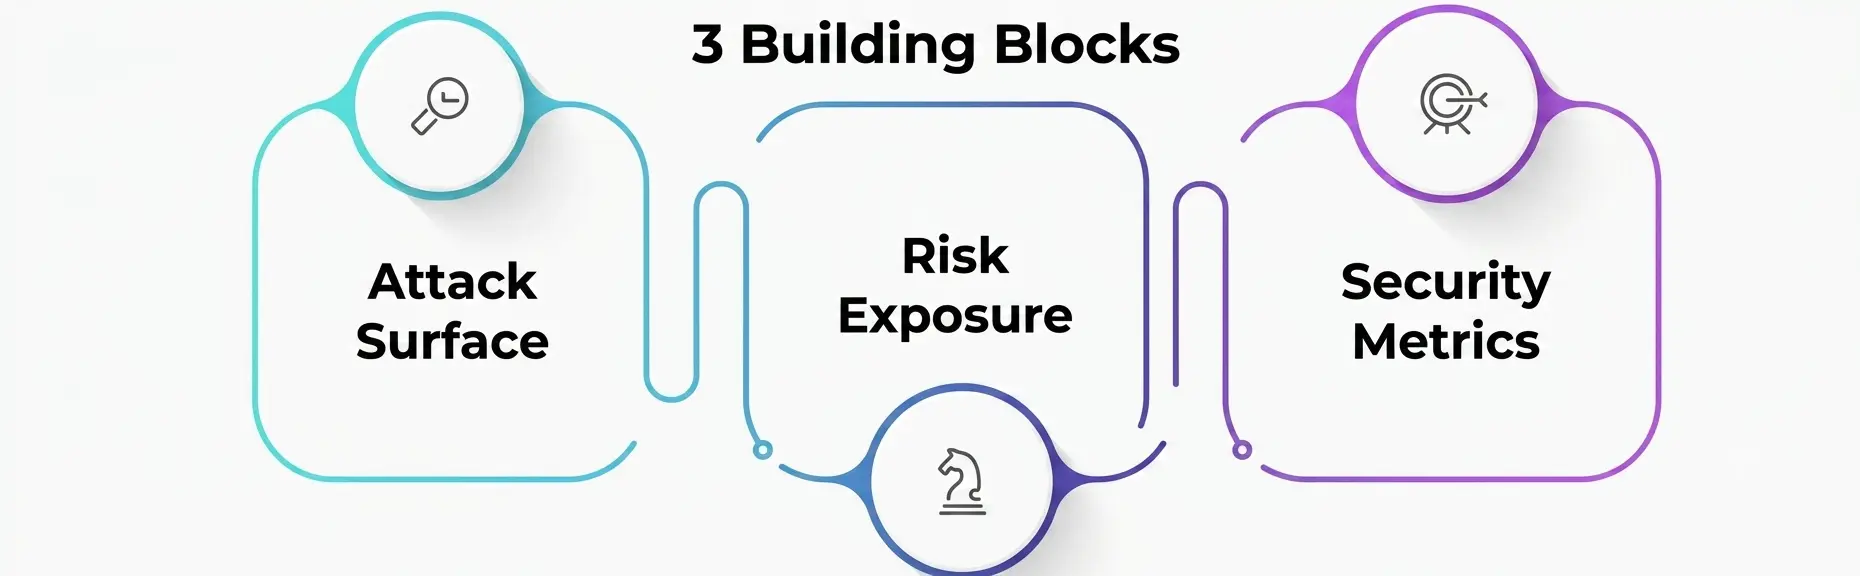
- Attack surface. This is the full inventory of servers, APIs, cloud assets, third-party connections, and even employee credentials that an attacker could target. You can’t quantify risk you haven’t mapped, so this discovery step usually comes first — CISA’s guidance on this discipline is a solid starting reference for students learning how this mapping actually works in practice.
- Risk exposure. This is what’s actually at stake if a given asset is compromised — data sensitivity, regulatory obligations, contractual penalties, and how dependent the business is on that system staying up. Two servers with identical vulnerabilities can carry very different consequences depending on what sits behind them.
- Security metrics. These are the raw numbers that feed the financial model: loss event frequency, mean time to detect, patch cadence, and control effectiveness. Weak inputs in any one of these areas will quietly distort the final quantified figure, which is arguably more dangerous than having no figure at all, because a wrong number with a dollar sign in front of it feels authoritative even when it isn’t.
Get any one of these three inputs wrong, and the number coming out the other end will be confidently wrong — precise-looking, and still useless for decision-making.
Qualitative Assessment vs. Cyber Risk Quantification
Students often ask why organizations don’t just quantify everything from day one. The honest answer is that qualitative scoring is faster and cheaper to start with, but it scales poorly once the business needs to defend budget decisions. Here’s a side-by-side comparison:
|
Dimension |
Qualitative Risk Assessment |
Cyber Risk Quantification |
|
Output format |
Color codes or 1–5 scores |
Dollar values or probability ranges |
|
Speed to implement |
Fast, minimal data needed |
Slower, needs historical loss and asset data |
|
Board-level clarity |
Often ambiguous (“what does ‘high’ cost us?”) |
Directly comparable to other financial risks |
|
Prioritization logic |
Analyst judgment |
Expected loss and likelihood modeling |
|
Best used for |
Early-stage programs, quick triage |
Budget justification, insurance, regulatory reporting |
|
Common frameworks |
Basic risk matrices |
FAIR, NIST CSF-aligned models |
Neither approach fully replaces the other — most mature cyber risk management programs actually run both, using qualitative scoring for day-to-day triage and quantification for anything that needs board or regulator sign-off.
Popular Models Behind Cyber Risk Quantification
Two frameworks come up constantly once you start reading about this field.
The FAIR model (Factor Analysis of Information Risk), maintained by the FAIR Institute and standardized through The Open Group, is currently the only widely recognized international standard built specifically for quantifying information and operational risk in financial terms.
It breaks risk down into loss event frequency and loss magnitude, then expresses the result as a probability distribution rather than a single guessed number — which is a more honest way to represent uncertainty than a single fixed severity score ever was.
The NIST Cybersecurity Framework (CSF 2.0) isn’t a quantification model by itself, but it’s frequently paired with one. NIST CSF gives organizations a common taxonomy — Govern, Identify, Protect, Detect, Respond, Recover — and quantification tools slot in underneath it to put numbers on the gaps the framework identifies.
Together, these two references cover most of what a student needs to understand the theory before touching a live cyber risk management platform. Beyond FAIR and NIST CSF, many programs borrow a technique from actuarial science: Monte Carlo simulation.
Instead of producing one guessed figure, the model runs thousands of randomized scenarios based on realistic ranges for frequency and impact, then plots the results as a loss curve — giving analysts a sense of both the likely outcome and the worst-case tail.
ISO 27005 is another reference some teams layer in alongside FAIR, mainly for its structured approach to identifying and evaluating information security risks before any financial modeling begins.
Building a Risk Quantification Program, Step by Step
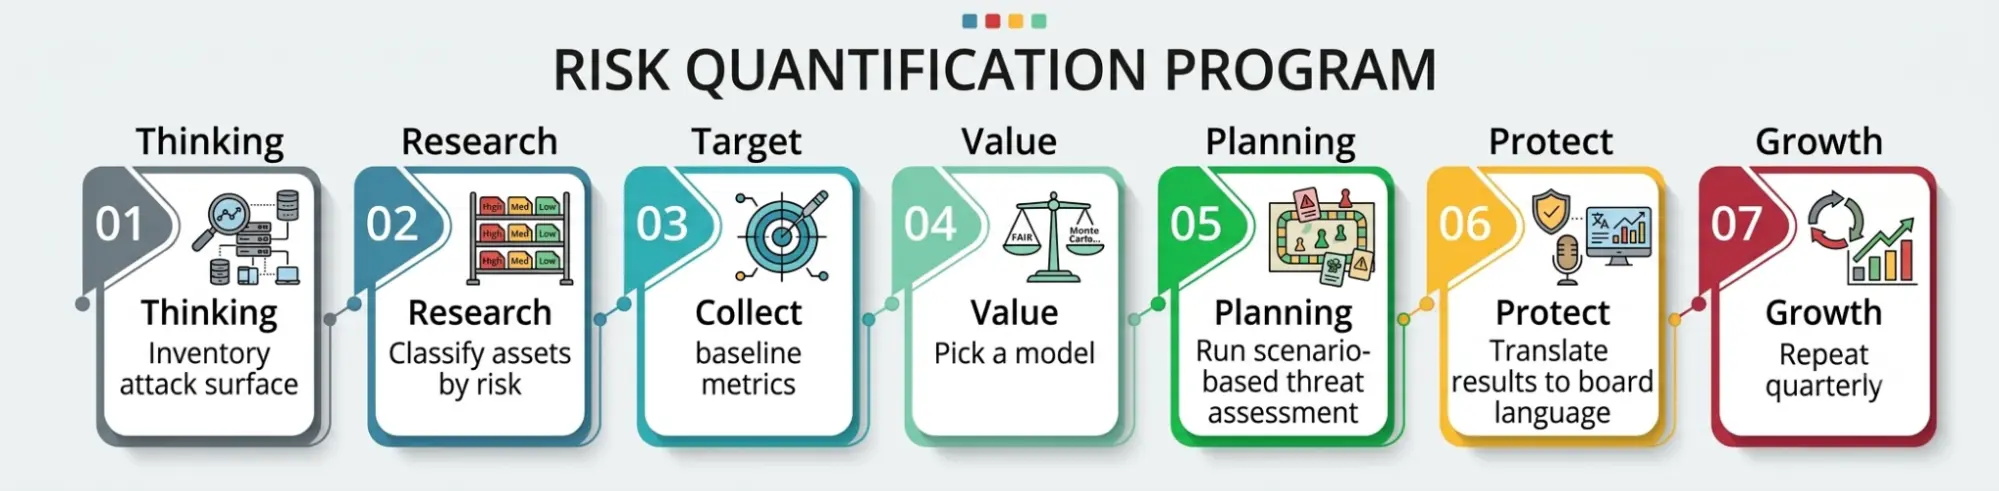
- Inventory the attack surface first. You cannot quantify what you haven’t discovered — start with asset discovery across cloud, on-premises, and third-party environments.
- Classify assets by risk exposure. Rank systems by data sensitivity, regulatory relevance, and how much revenue or operation depends on them.
- Collect baseline security metrics. Pull historical incident data, patch timelines, and control effectiveness scores; without real data, quantification becomes guesswork with extra steps.
- Pick a model. FAIR is the most common starting point for financial quantification; smaller teams sometimes start simpler and mature into it.
- Run scenario-based threat assessment. Model specific scenarios — ransomware on the finance server, a third-party breach, a cloud misconfiguration — rather than trying to quantify “all cyber risk” at once.
- Translate results into board language. Present ranges, not false precision — “$1.2M–$3.4M expected annual loss” is more honest and more useful than a single invented number.
- Repeat quarterly. This isn’t a one-time report; what’s exposed today may look very different next quarter.
Where Does This Fit Inside Cyber Risk Management?
Quantification isn’t a replacement for the broader discipline — it’s one input into it. A full cyber risk management program still needs governance, incident response, vendor risk oversight, and security controls.
What quantification adds is a common financial language that connects security decisions to business decisions, which is exactly what Gartner’s 2026 cybersecurity research has been pointing at: CISOs are under growing pressure to show measurable, financially framed outcomes rather than activity counts, because boards increasingly want to know whether spending is actually reducing exposure over time, not just whether more tools got deployed.
Common Mistakes Students and Teams Make
- Treating the output as a fact instead of an estimate. Every quantified figure is a modeled range built on assumptions; presenting it as gospel undermines credibility the first time it’s challenged.
- Skipping attack surface discovery. A quantification model run against an incomplete asset list will always understate real risk exposure.
- Using stale security metrics. Feeding a model of last year’s incident data produces confidently wrong numbers this year.
- Trying to quantify everything at once. Start with the three or four scenarios that matter most to the business, not an exhaustive catalog of every theoretical threat.
- Underestimating third-party exposure. Vendors and supply-chain partners often sit outside the primary asset inventory entirely, yet a single compromised vendor can trigger losses just as large as an internal incident.
- Ignoring the human side of risk exposure. Phishing susceptibility, insider behavior, and process gaps rarely show up in asset inventories but shape real-world outcomes just as much as technical flaws do.
The Future: AI and Continuous Cyber Risk Quantification
Static, once-a-year risk reports are losing relevance fast. What an organization exposes to the internet now changes daily as teams spin up new cloud services, onboard vendors, and adopt AI tools — some of it sanctioned, some of it not.
The next phase of this discipline is continuous rather than periodic: models that recalculate exposure automatically as new assets appear, new vulnerabilities are disclosed, or a fresh review flags a change in attacker behavior. For students entering this field, that shift means the valuable skill isn’t just knowing a formula — it’s knowing how to keep the underlying inputs fresh enough that the formula stays honest.
Conclusion
Cyber Risk Quantification won’t replace the judgment of experienced security professionals, and it isn’t a magic number generator either. What it does is give security teams, executives, and boards a shared, defensible way to talk about risk exposure in the same terms they already use for every other business decision.
Combined with a mapped attack surface, current security metrics, and a disciplined threat assessment process, quantification turns cyber risk management from a technical checklist into a financial conversation — which, in 2026, is the conversation every board actually wants to have.
A Personal Note
I’ve sat through more “red-amber-green” security briefings than I can count, and the moment a room actually pays attention is the moment someone says “this specific gap could cost us roughly $2 million this year if left unpatched.” Numbers cut through noise in a way color-coded charts never will.
If you’re a student building toward a career in this space, my honest advice is to get comfortable with the math and the assumptions behind it before you get comfortable with any single tool — the frameworks will keep evolving, but the discipline of turning a technical finding into a defensible financial estimate is the part that keeps you useful for the long run.