
Web servers are the backbone of the internet. They host websites, handle user requests, and serve content to millions of users every day. Popular web servers like Apache, Nginx, and IIS (Internet Information Services) generate logs that record every activity happening on the server. These logs are incredibly valuable—they help in troubleshooting issues, improving performance, and detecting security threats. In this blog, we’ll explore web server log analysis in a simple and human-friendly way.
What Are Web Server Logs?
A web server log is a file that keeps track of all requests made to the server. Each entry in the log contains important details like:
- IP address of the visitor
- Timestamp of the request
- HTTP method used (GET, POST, etc.)
- Requested URL or resource
- Status code returned (200, 404, 500, etc.)
- User agent (browser or device information)
- Referrer URL (where the visitor came from)
Logs are like a diary for your web server—they record what happens on your site so you can review it later.
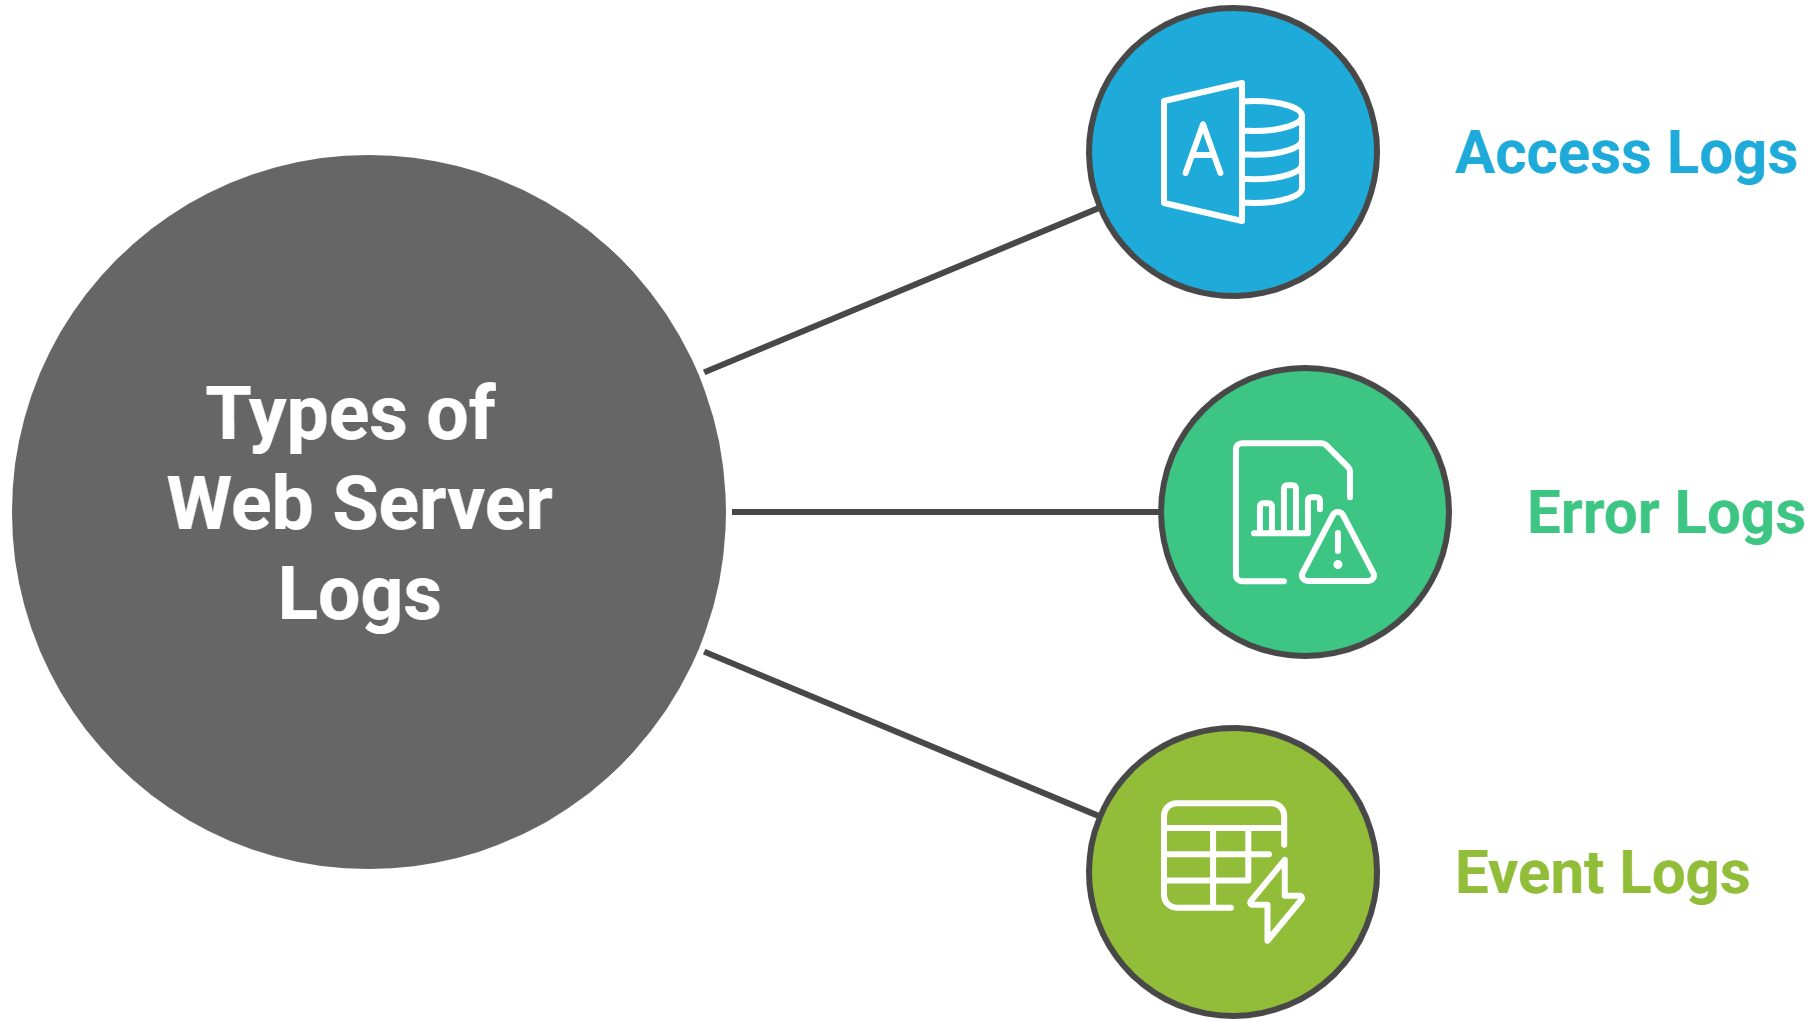
Types of Web Server Logs
Different servers may generate slightly different types of logs, but the basic categories are similar:
-
Access Logs:
- These logs record all requests to the server.
- Example: User visits a page, downloads a file, or submits a form.
- Useful for analyzing traffic patterns, popular pages, or unusual activity.
-
Error Logs:
- These logs record server errors, such as missing files (404), server crashes (500), or permission issues.
- Useful for troubleshooting problems and identifying bugs in your website.
-
Event Logs (IIS specific):
- IIS maintains event logs for server events like application pool failures, configuration changes, or security warnings.
- Helps in tracking server health and administrative changes.
Apache Web Server Log Analysis
Apache is one of the most popular web servers, known for its flexibility and wide use. Its logs are usually stored in /var/log/apache2/ on Linux systems.
Common Apache Logs:
- access.log: Tracks every request made to the server.
- error.log: Tracks errors encountered while processing requests.
How to Analyze Apache Logs:
- Manual Analysis: You can open log files using tools like cat, less, or tail in Linux.
Example: tail -f /var/log/apache2/access.log shows live requests as they happen. - Using Tools:
- GoAccess: A real-time web log analyzer with visual reports.
- AWStats: Generates detailed web statistics and traffic analysis.
Key Insights from Apache Logs:
- Traffic trends: Which pages are most visited?
- User demographics: Where are your visitors coming from?
- Error detection: Identify broken links or server issues.
- Security analysis: Detect suspicious IP addresses or attack attempts.
Nginx Web Server Log Analysis
Nginx is known for its speed, low resource usage, and ability to handle many connections at once. Nginx logs are usually in /var/log/nginx/.
Nginx Log Files:
- access.log: Similar to Apache, records all requests.
- error.log: Records errors, warnings, and critical events.
Analyzing Nginx Logs:
- Command-line tools: grep, awk, and sed are useful for filtering and extracting data.
- Log analyzers: Tools like GoAccess, Elastic Stack (ELK), and Splunk help visualize traffic patterns and server performance.
Benefits of Nginx Log Analysis:
- Monitor high traffic spikes and performance issues.
- Identify unusual activity that may indicate security threats.
- Improve server efficiency by finding slow requests.
IIS Web Server Log Analysis
IIS (Internet Information Services) is Microsoft’s web server and is commonly used in Windows environments. IIS logs are typically stored in C:\inetpub\logs\LogFiles.
IIS Log Contents:
- Client IP address
- User name (if authentication is used)
- Request method (GET, POST, etc.)
- URI stem (requested page or resource)
- HTTP status code
- Bytes sent/received
- User agent
Analyzing IIS Logs:
- Manual analysis: Open the .log files in Notepad or Excel.
- Automated tools: Use Log Parser, Splunk, or ELK Stack for deeper insights.
Why Web Server Log Analysis Is Important
- Security Monitoring:
- Logs can reveal attacks like SQL injection, DDoS attempts, or brute-force login attempts.
- Performance Optimization:
- Identifying slow-loading pages or resources helps improve website speed.
- Troubleshooting:
- Error logs provide clues to fix broken links, misconfigurations, or application bugs.
- Compliance and Auditing:
- Many regulations require keeping server logs for a certain period.
- Helps prove your site follows legal and security standards.
Tools for Web Server Log Analysis
Here are some popular tools to make log analysis easier:
- GoAccess: Real-time web log analysis with graphs.
- AWStats: Detailed statistics and traffic reports.
- Splunk: Enterprise-level log management and analysis.
- ELK Stack (Elasticsearch, Logstash, Kibana): Centralized logging and visualization.
- Log Parser (for IIS): Powerful query tool for Windows logs.
Conclusion
Web server logs are a goldmine of information. Whether you use Apache, Nginx, or IIS, analyzing these logs helps you understand your visitors, improve performance, and enhance security. By regularly monitoring access and error logs, using proper tools, and setting up alerts, you can prevent issues before they escalate and ensure your website runs smoothly.
Remember, log analysis is not just for experts—even beginners can start learning from logs to make their websites safer and more efficient. Start small, track key metrics, and over time, you’ll gain valuable insights that can significantly improve your web infrastructure.
